During testing and attempting to find the perfect (well…most nearly perfect) classifier, below are the trial runs and their statistical summaries. The Trial numbers are clickable links to a more verbose detailed section of how the run was constructed and graphs of the data from the outputs.
| Trial Number | Hits | Misses | Total | False Alarms | Hits % |
|---|---|---|---|---|---|
| haarcascade1 | 587 | 1183 | 1770 | 2485 | 33.16% |
| haarcascade2 | 567 | 1203 | 1770 | 11213 | 32.03% |
| haarcascade3 | 528 | 1242 | 1770 | 21154 | 29.83% |
| haarcascade4 | 800 | 970 | 1770 | 184097 | 45.20% |
| haarcascade5 | 680 | 1090 | 1770 | 4518 | 38.42% |
| haarcascade6 | 6 | 1764 | 1770 | 376 | 0.34% |
| haarcascade7 | 140 | 1630 | 1770 | 3447 | 7.91% |
| haarcascade8 | 1009 | 761 | 1770 | 20112 | 57.01% |
| haarcascade9 | 125 | 1645 | 1770 | 111 | 7.06% |
| haarcascade10 | 567 | 1203 | 1770 | 11213 | 32.03% |
| haarcascade11 | 41 | 1729 | 1770 | 237384 | 2.32% |
| haarcascade12 | 0 | 1700 | 1770 | 4200 | 0% |
| haarcascade15 | 1011 | 759 | 1770 | 8873 | 57.12% |
| haarcascade18 | 1004 | 894 | 1898 | 9682 | 56.72% |
| haarcascade20 | % | ||||
| haarcascade21 | 6192 | 288 | 6480 | 95058 | 95.55% |
The table represents the data When running each classifier against a defined validation set which contains 1134 positive images and in those images there are a total of 1770 solar cavities that exist.
Hits – The total number of correct identifications of solar cavities
Misses – The total number of missed solar cavities
Total – The total number of solar cavities in validation set
False Alarms – The total number of false detections made
Hits % – Hit percentage of the classifier [Hits/Total]
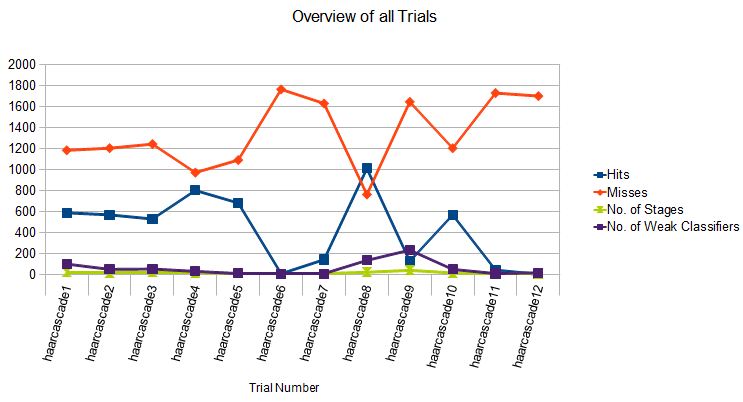
Below is a chart that shows the following specific data points for Hits, Misses, Number of Stages and Weak Classifiers for all of the current trial runs. This table is to aid in finding any trends that would help create better classifiers, by easily seeing how the data fits together.

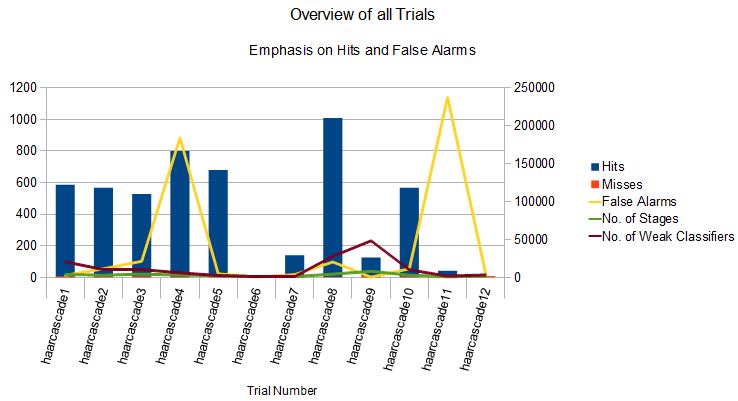
The next chart shows the following specific data points for Hits, Misses, Number of Stages, Number of Weak Classifiers and False Alarms for all of the current trial runs, with graphical emphasis on the Hits versus False Alarms.

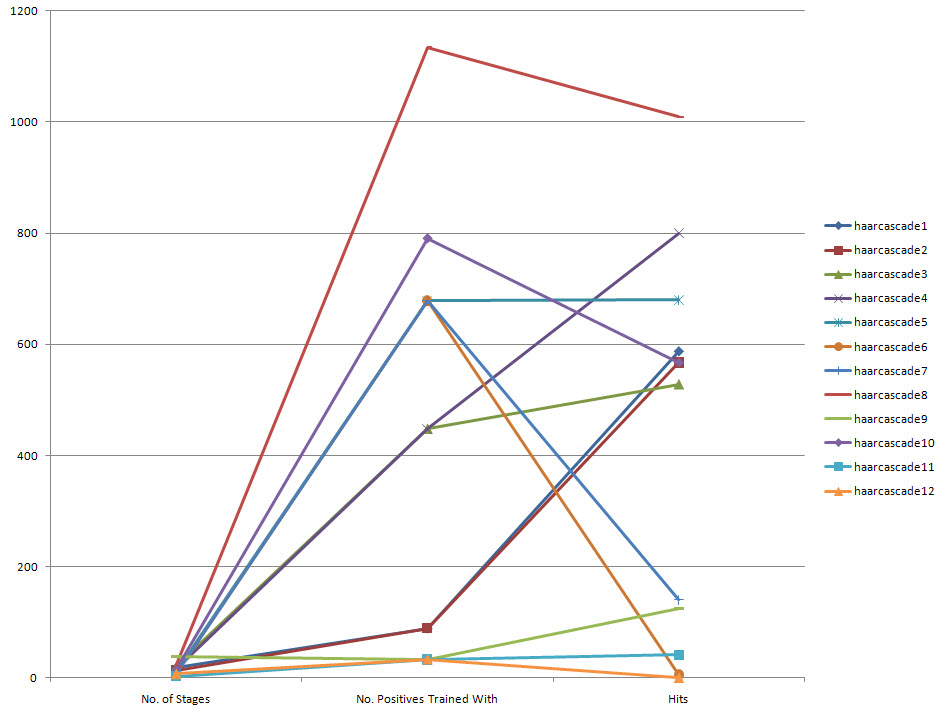
Figure showing the number of positive images used in training the classifier and how that corresponds to the number of Hits that classifier detected. It shows that typically with the more images you train your classifier against you will generally have a better Hits count. Although, there should be minimum number of the most distinct positives that you can train your classifier with, with maybe some distortions on the samples for variance so that marking thousands of images no longer needs to happen for a good classifier.

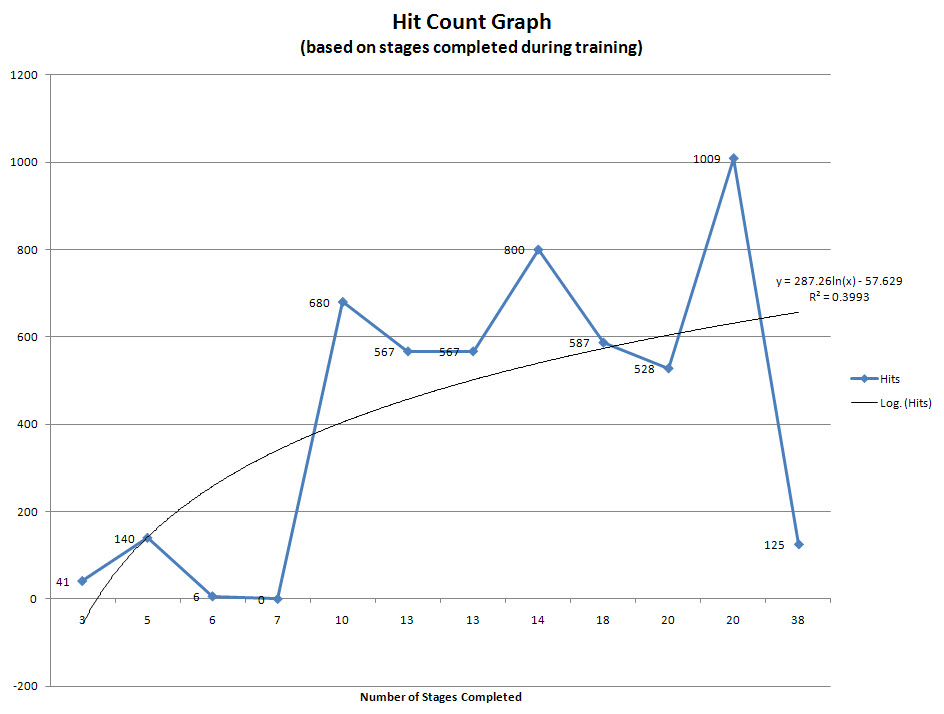
The follow graph shows the mapping of data for the hit count numbers based on the number of stages that classifier completed. Based on the graph of results I think its pretty fair to say that the number of stages does not directly correlate to a higher number of hits. I believe that there exists a boundary line that no matter if you set your stage count to something extremely high it will not necessarily increase your hit count as well as this is proved from the opencv_haartraining.exe where if the value of the false alarm rate becomes so low the program will exit.
Required leaf false alarm rate achieved. Branch training terminated.
Tags: testing outcomes, trials
