Training Options Used –
-npos 1898
-nneg 625
-nstages 20
-mode ALL
The number of positive images used to train this classifier was 1898, the number of negative images used was 625 and specified that the number of stages the trainer should try to complete is 20. Used the mode ALL switch, which not only includes the basic haar like features but an extended set of features, here is a link to the feature sets Haar-like features. During the training phase of this cascade it finished in stage 20, which created 139 total weak classifiers. In this stage it reached the desired minimum false alarm rate, or else the false alarm rate will be too high for real world use. This positive set had a few more images, most of the additions were from images that contained a cavity in Quadrant 3, and the image was rotated and saved as new image so that its cavity now resides in Quadrant 1.
NEG: 148 9.77509e-005
Used a modified version of the OpenCV haartrainer.
-data "F:\Thesis Research\AutomatedCMEDetector\HaarClassifier\haarcascade18" -vec "F:\Thesis Research\AutomatedCMEDetector\Test Sets\Positive Solar Cavities\positivesoutput.vec" -bg "F:\Thesis Research\AutomatedCMEDetector\Test Sets\Negative Solar Cavities\negatives.txt" -npos 1134 -nneg 625 -nstages 20 -mode ALL
Hit rate ≈ 56.7%
Tags: testing outcomes, trials
In running through tests against all the haarcascades I create, I noticed that the number of Misses in Quadrant III seemed surprisingly high, even when the cavity was a very distinct one.
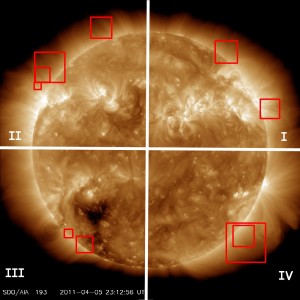
Here is an example of the original image that was used to train the cascades. Here is an output file from the performance testing which shows the objects it detected as positive; there is the main cavity that is missed in Quadrant III.
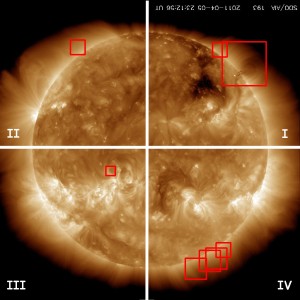
I then tried rotating the image 180 degrees, and ran the performance tester on the set of images again and in the next image you see that now it detected the cavity now that its angle has changed and now resides in Quadrant I.
Because of this discovery, I am currently implementing a new technique of solar cavity detection. Attempting to take a good candidate cavity and rotate it along the rim of the entire disk. So now every quadrant has a good candidate along every position to teach the classifier. Next, in order to reduce false positives apply template matching within those regions of interest.
Tags: Haar Classifier, haar training, opencv, solar cavity, testing outcomes, thesis
Thought I would share this video I found, I think it gives alot of insight into the importance of solar research as well as it has some great info and visuals for solar weather and the benefits of the new observation satellite SDO.
Enjoy!
Tags: media
Training Options Used –
-npos 448
-nneg 587
-nonsym
-mode ALL
The number of positive images used to train this classifier was 448, the number of negative images used was 587 and did not specify the number of stages the trainer should try to complete, so by default it tries to achieve 14 stages. The “-nonsym” option is used when the object class does not have vertical (left-right) symmetry. The “-mode ALL” uses the extended sets of Haar-like features, the default is BASIC and it uses only upright features, while ALL flag uses the full set of upright and 45 degree rotated feature set. During the training phase of this cascade it finished in stage 14, which created 28 total weak classifiers.
NEG: 27 0.00258225
Hit rate ≈ 45.1%
Tags: testing outcomes, trials
Training Options Used –
-npos 448
-nneg 587
-nstages 20
The number of positive images used to train this classifier was 44, the number of negative images used was 587and specified that the number of stages the trainer should try to complete is 20.
With this cascade the trainer was able to reach its set goal of 20 stages, which created 51 total weak classifiers.
NEG: 27 0.000192682
Hit rate ≈ 29.8%
Tags: testing outcomes, trials
Training Options Used –
-npos 89
-nneg 479
-nstages 20
The number of positive images used to train this classifier was 89, the number of negative images used was 479 and specified that the number of stages the trainer should try to complete is 20.
During the training phase of this cascade it finished in stage 18, which created 98 total weak classifiers. In this stage it reached the desired minimum false alarm rate, or else the false alarm rate will be too high for real world use.
NEG: 365 2.52601e-006
Hit rate ≈ 33.1%
Tags: testing outcomes, trials
Training Options Used –
-npos 1134
-nneg 625
-nstages 20
The number of positive images used to train this classifier was 1134, the number of negative images used was 625 and specified that the number of stages the trainer should try to complete is 20.
With this cascade the trainer was able to reach its set goal of 20 stages, which created 133 total weak classifiers.
NEG: 146 0.000125991
Hit rate ≈ 57.0%
Tags: testing outcomes, trials
Training Options Used –
-npos 89
-nneg 479
-nonsym
-mode ALL
The number of positive images used to train this classifier was 89, the number of negative images used was 479 and did not specify the number of stages the trainer should try to complete, so by default it tries to achieve 14 stages. The “-nonsym” option is used when the object class does not have vertical (left-right) symmetry. The “-mode ALL” uses the extended sets of Haar-like features, the default is BASIC and it uses only upright features, while ALL flag uses the full set of upright and 45 degree rotated feature set. During the training phase of this cascade it finished in stage 13, which created 47 total weak classifiers. In this stage it reached the desired minimum false alarm rate, or else the false alarm rate will be too high for real world use.
NEG: 365 4.67794e-005
Hit rate ≈ 32.0%
Tags: testing outcomes, trials
During testing and attempting to find the perfect (well…most nearly perfect) classifier, below are the trial runs and their statistical summaries. The Trial numbers are clickable links to a more verbose detailed section of how the run was constructed and graphs of the data from the outputs.
| Trial Number | Hits | Misses | Total | False Alarms | Hits % |
|---|---|---|---|---|---|
| haarcascade1 | 587 | 1183 | 1770 | 2485 | 33.16% |
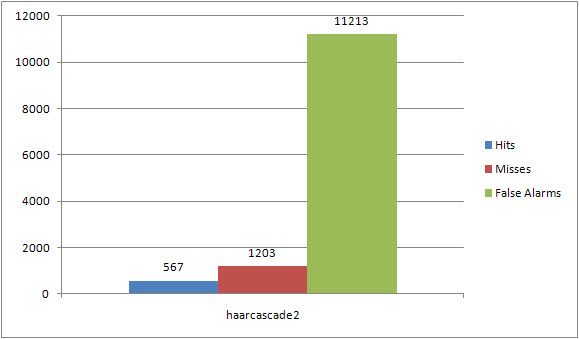
| haarcascade2 | 567 | 1203 | 1770 | 11213 | 32.03% |
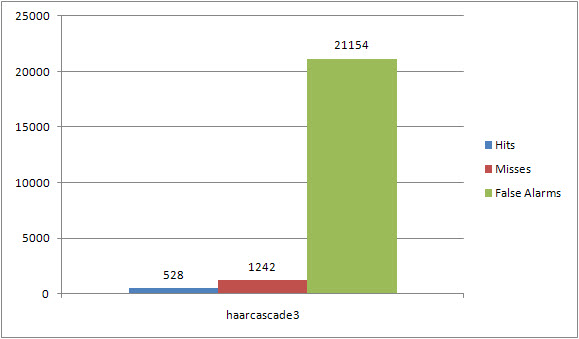
| haarcascade3 | 528 | 1242 | 1770 | 21154 | 29.83% |
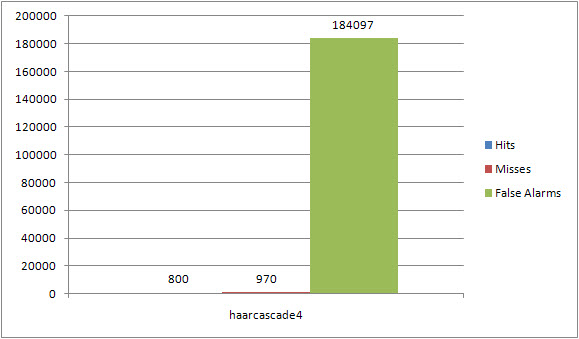
| haarcascade4 | 800 | 970 | 1770 | 184097 | 45.20% |
| haarcascade5 | 680 | 1090 | 1770 | 4518 | 38.42% |
| haarcascade6 | 6 | 1764 | 1770 | 376 | 0.34% |
| haarcascade7 | 140 | 1630 | 1770 | 3447 | 7.91% |
| haarcascade8 | 1009 | 761 | 1770 | 20112 | 57.01% |
| haarcascade9 | 125 | 1645 | 1770 | 111 | 7.06% |
| haarcascade10 | 567 | 1203 | 1770 | 11213 | 32.03% |
| haarcascade11 | 41 | 1729 | 1770 | 237384 | 2.32% |
| haarcascade12 | 0 | 1700 | 1770 | 4200 | 0% |
| haarcascade15 | 1011 | 759 | 1770 | 8873 | 57.12% |
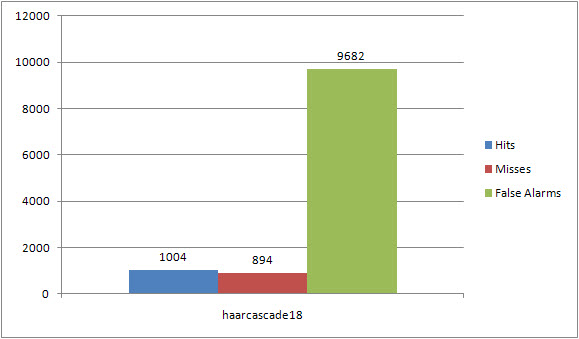
| haarcascade18 | 1004 | 894 | 1898 | 9682 | 56.72% |
| haarcascade20 | % | ||||
| haarcascade21 | 6192 | 288 | 6480 | 95058 | 95.55% |
The table represents the data When running each classifier against a defined validation set which contains 1134 positive images and in those images there are a total of 1770 solar cavities that exist.
Hits – The total number of correct identifications of solar cavities
Misses – The total number of missed solar cavities
Total – The total number of solar cavities in validation set
False Alarms – The total number of false detections made
Hits % – Hit percentage of the classifier [Hits/Total]
Below is a chart that shows the following specific data points for Hits, Misses, Number of Stages and Weak Classifiers for all of the current trial runs. This table is to aid in finding any trends that would help create better classifiers, by easily seeing how the data fits together.
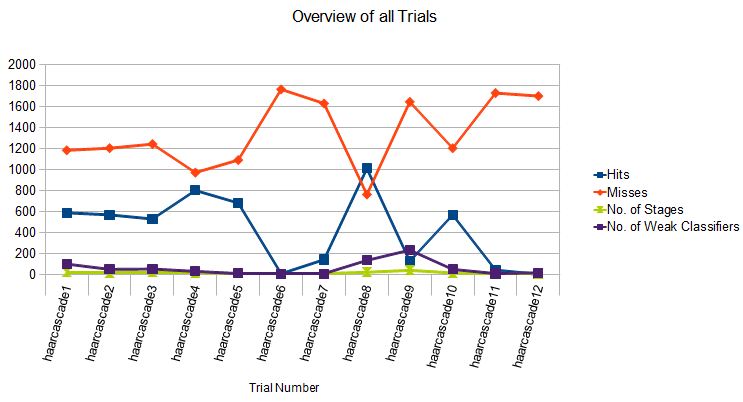
The next chart shows the following specific data points for Hits, Misses, Number of Stages, Number of Weak Classifiers and False Alarms for all of the current trial runs, with graphical emphasis on the Hits versus False Alarms.
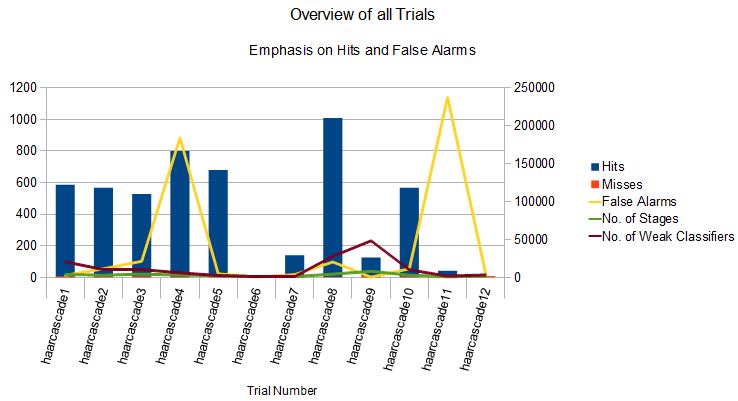
Figure showing the number of positive images used in training the classifier and how that corresponds to the number of Hits that classifier detected. It shows that typically with the more images you train your classifier against you will generally have a better Hits count. Although, there should be minimum number of the most distinct positives that you can train your classifier with, with maybe some distortions on the samples for variance so that marking thousands of images no longer needs to happen for a good classifier.
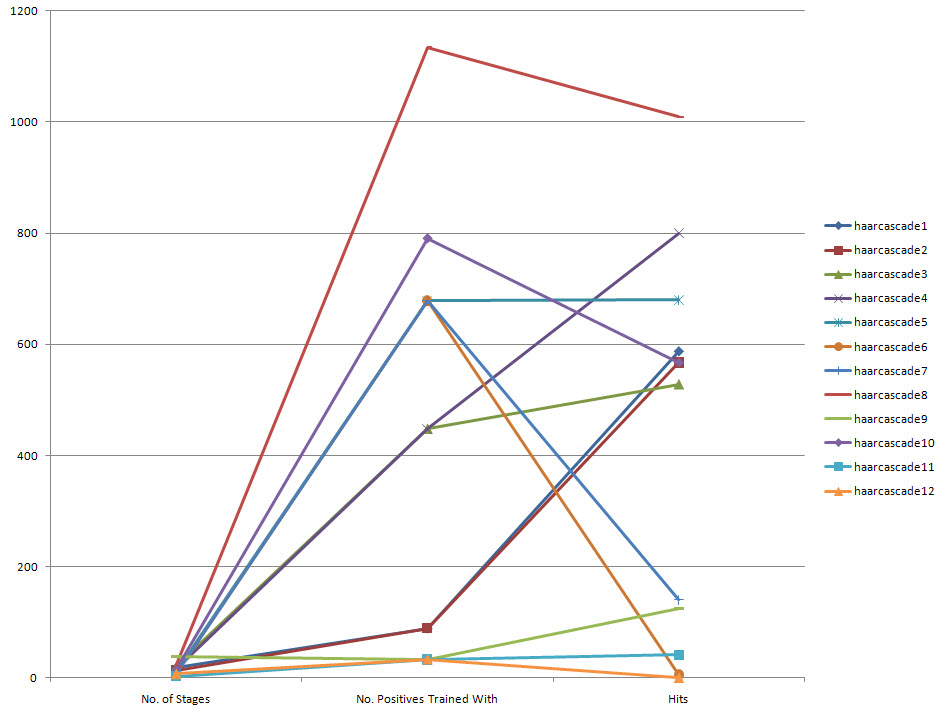
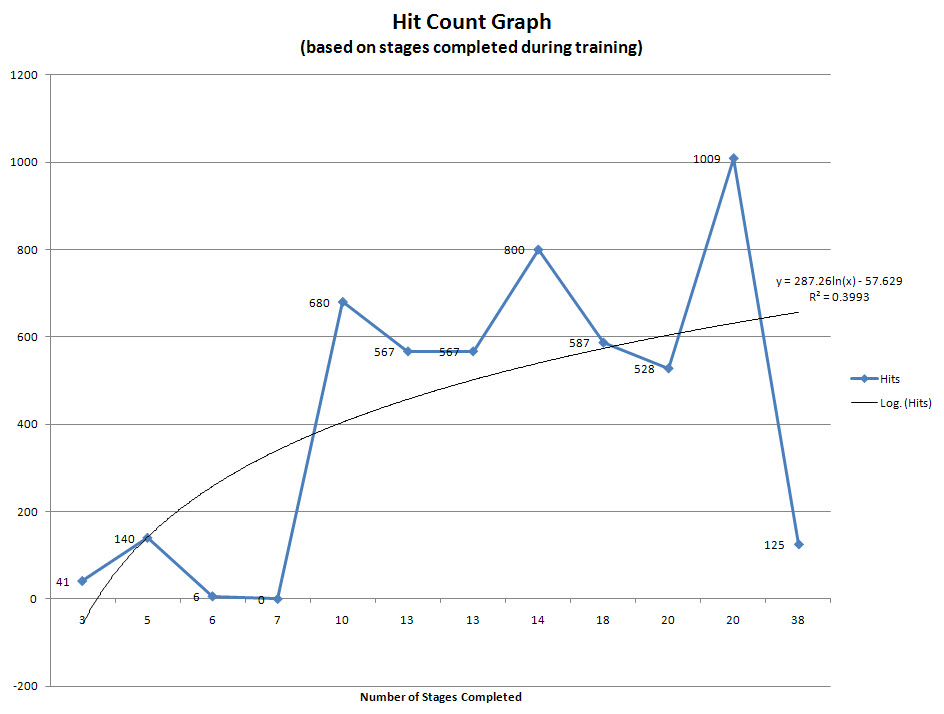
The follow graph shows the mapping of data for the hit count numbers based on the number of stages that classifier completed. Based on the graph of results I think its pretty fair to say that the number of stages does not directly correlate to a higher number of hits. I believe that there exists a boundary line that no matter if you set your stage count to something extremely high it will not necessarily increase your hit count as well as this is proved from the opencv_haartraining.exe where if the value of the false alarm rate becomes so low the program will exit.
Required leaf false alarm rate achieved. Branch training terminated.
Tags: testing outcomes, trials

Once a solar cavity is identified the next obstacle is getting data from the region such as the area, proximity to the disk, latitude, longitude, curvature, etc., which entails finding the edges of the cavity. In processing we can segment the region of interest as well as enhancing it to bring out the features you are looking for. For my purpose I did some adjustments on the brightness, contrast, Gaussian blur, conversion to a grayscale image as well as attempting to equalize the histogram among other things. With low contrast images it became very difficult to distinguish the true edges of an object when those edges and surrounding areas are so close in intensity (color value).
So in the mean time I’m working on a different approach to essentially get around this for the sake of my thesis and my timeframe to maybe come back to this at a later time; as I would really like to solve this problem in relation to solar cavities as I think it could provide vital data for analysis purposes.
Tags: image processing, low contrast
