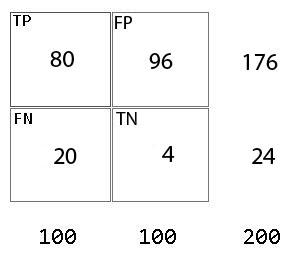
In an attempt to analyze some data as well as performance of my classifier and implementation on solar cavity detection I decided it would be beneficial to see the data in terms of individual quadrant performance. Below is the confusion matrix for the outcomes of the Quadrant I, based on 100 q1 (quadrant 1) positive images and 100 q1 (quadrant 1) negative images.
This matrix shows the outcomes from loading the classifier in raw form; without taking into consideration eliminating criteria such as proximity to disk, intensity, or template matching probability percentage just so I can show the significance of the elimination implementation. So to be clear, of the 100 positives for example I based the True Positive value on whether it correctly identified the solar cavity in that quadrant regardless of other detections it identified. So in keeping it essentially “black and white” or “Yes, it detected the cavity or No, it did not”.
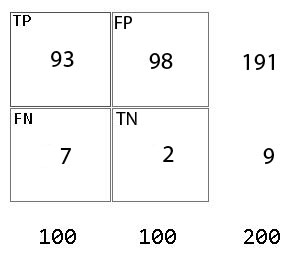
Finally here is the confusion matrix, for the outcomes based on loading the classifier and then performing elimination criteria on the detected regions of interest. The classifier could sometimes return overlapping regions of interest. In terms of solar cavities I eliminate this as being applicable because I do not and have not really seen any solar cavities that are in that close of proximity that they would begin to overlap. So due to that the removal of overlapping regions of interest seems appropriate. I also set a range of values that when in gray scale it was a range of mid values and if the region of interest did not include some darker gray levels then the region is not considered a region of interest.
If the region of interest is not in close proximity to the disks edge (suns edge) then this can be eliminated as a region of interest since all solar cavities are close in proximity to the edge. Once the region has passed all the criteria above then we have our set of templates for each quadrant, that was designated as good samples of cavities within each quadrant. So a template matcher implementation is run on the region to further determine if it should be kept as a region of interest of discarded.
Tags: testing outcomes, thesis, trials

